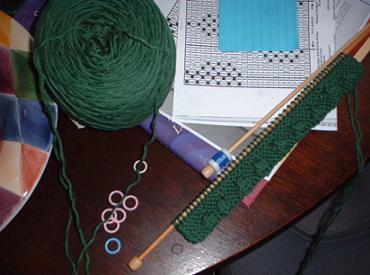
This is what's left after I ripped this.
 Several days of knitting, gone in just a few minutes. I've been trying to make myself believe that this lace pattern would be all right even if there were an error in it. I just couldn't stand it though.
 There's clearly a discrepancy between the chart and what results. It certainly didn't look like the picture. So I played around with the chart and I think I now have what was intended, at least it looks like the picture. I've already ripped the sample I did to try out my theory.
So, starting over. I'm pretty sure I won't make my self-imposed deadline but I'll be a lot happier with the result. Otherwise, it's back to the drawing board, again.
No comments:
Post a Comment